Graphing: Making Equations Visible
The coordinate plane was a philosophical breakthrough as much as a mathematical one. When Descartes unified algebra and geometry, equations became pictures and pictures became solvable. Here's why that translation works.
A graph is an equation you can see.
Every point on the graph represents a pair of numbers that makes the equation true. The graph of y = 2x is every point where the y-coordinate is twice the x-coordinate: (1,2), (3,6), (-2,-4), infinitely many.
Here's the unlock: graphing translates algebra into geometry. An equation is a relationship between numbers. A graph is that relationship drawn in space. Same information, different form — and the visual form often reveals patterns the symbolic form hides.
When you graph an equation, you're not just following a procedure. You're making the math visible.
The Coordinate Plane
Two perpendicular number lines create a coordinate system:
- Horizontal: x-axis
- Vertical: y-axis
- Origin: (0, 0), where they cross
Every point has coordinates (x, y):
- x = horizontal position
- y = vertical position
The plane is divided into four quadrants:
- I: (+, +) upper right
- II: (-, +) upper left
- III: (-, -) lower left
- IV: (+, -) lower right
Plotting Points
To plot (3, 2):
- Start at origin
- Go right 3 units
- Go up 2 units
- Mark the point
To plot (-1, 4):
- Start at origin
- Go left 1 unit
- Go up 4 units
Negative x means left. Negative y means down.
Graphing by Plotting Points
The most direct method: make a table, plot points, connect them.
Example: y = x²
| x | y |
|---|---|
| -2 | 4 |
| -1 | 1 |
| 0 | 0 |
| 1 | 1 |
| 2 | 4 |
Plot these five points. See the U-shape emerge. Draw the smooth curve through them.
The more points, the more accurate. But often a few strategic points reveal the pattern.
Linear Functions: y = mx + b
Linear functions graph as straight lines.
m = slope: How steep the line is. Rise over run. b = y-intercept: Where the line crosses the y-axis.
y = 2x + 1:
- Slope 2: for every 1 step right, go 2 steps up
- y-intercept 1: the line passes through (0, 1)
To graph:
- Plot the y-intercept (0, b)
- Use slope to find another point: from (0, 1), go right 1 and up 2 to (1, 3)
- Draw the line through both points
Slope
Slope = rise / run = (y₂ - y₁) / (x₂ - x₁)
- Positive slope: Line rises left to right
- Negative slope: Line falls left to right
- Zero slope: Horizontal line
- Undefined slope: Vertical line
Slope measures rate of change. A slope of 3 means y increases 3 units for every 1 unit increase in x.
Intercepts
y-intercept: Where the graph crosses the y-axis. Set x = 0, solve for y.
x-intercept: Where the graph crosses the x-axis. Set y = 0, solve for x.
For y = 2x - 6:
- y-intercept: y = 2(0) - 6 = -6 → point (0, -6)
- x-intercept: 0 = 2x - 6 → x = 3 → point (3, 0)
Two points are enough to draw a line.
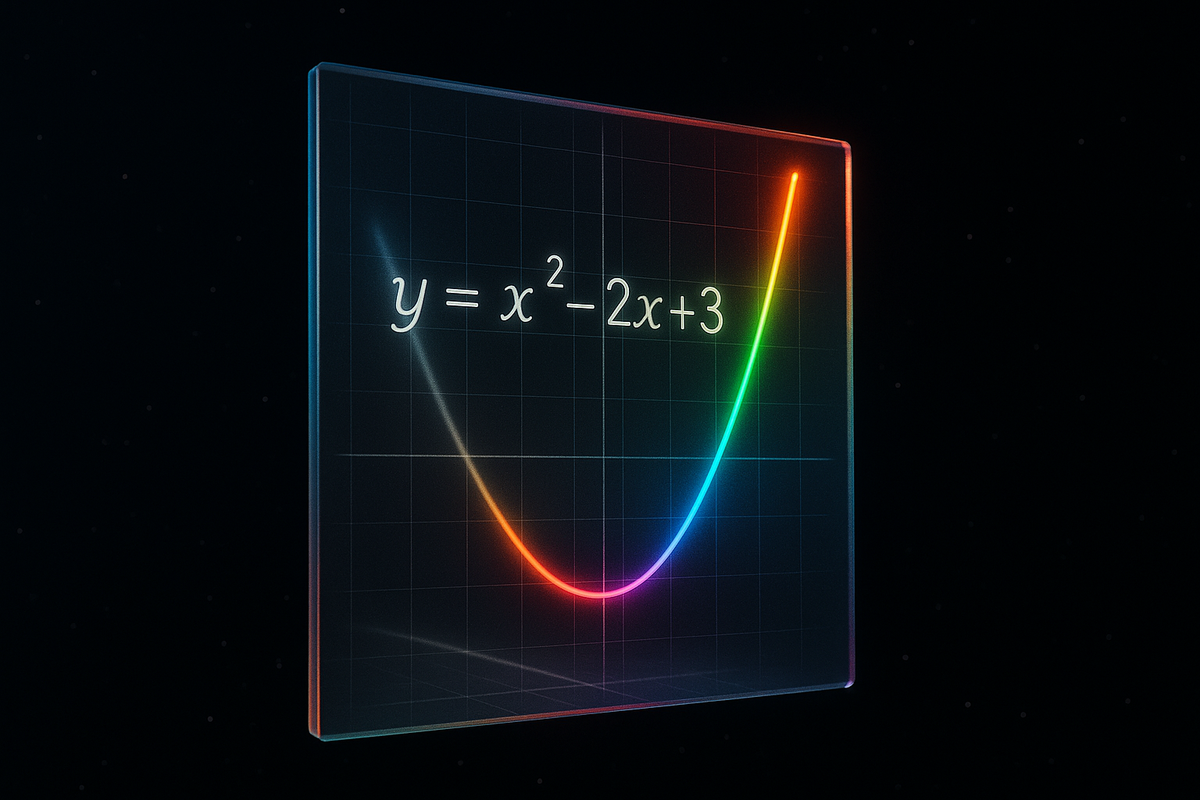
Quadratic Functions: y = ax² + bx + c
Quadratics graph as parabolas — U-shaped curves.
- a > 0: Opens upward (smiling)
- a < 0: Opens downward (frowning)
- |a| large: Narrow parabola
- |a| small: Wide parabola
Key features:
- Vertex: The highest or lowest point
- Axis of symmetry: Vertical line through vertex: x = -b/(2a)
- y-intercept: (0, c)
Finding the Vertex
For y = ax² + bx + c:
x-coordinate of vertex: x = -b/(2a)
Then plug back in to find y.
Example: y = x² - 4x + 3
x = -(-4)/(2·1) = 4/2 = 2 y = (2)² - 4(2) + 3 = 4 - 8 + 3 = -1
Vertex: (2, -1)
The vertex is where the parabola turns around.
Transformations
Starting from a basic graph, transformations shift, stretch, or flip it.
Vertical shift: y = f(x) + k shifts up by k (down if k < 0) Horizontal shift: y = f(x - h) shifts right by h (left if h < 0) Vertical stretch: y = af(x) stretches vertically by factor a Reflection over x-axis: y = -f(x) flips the graph upside down
Example: y = (x - 2)² + 3 is the basic parabola y = x² shifted right 2 and up 3.
Reading Graphs
Graphs reveal information at a glance:
- Intercepts: Where it crosses the axes
- Increasing/decreasing: Where it goes up or down
- Maximum/minimum: Highest or lowest points
- Zeros: x-values where the graph touches the x-axis
- Symmetry: Does it mirror itself?
A graph shows the entire function's behavior — all inputs and outputs, simultaneously.
Solving Equations Graphically
To solve f(x) = g(x), graph both functions. The x-coordinates of intersection points are the solutions.
To solve x² = 2x + 3:
- Graph y = x²
- Graph y = 2x + 3
- Find where they intersect
This is often easier than algebraic manipulation, especially for complicated equations.
Systems of Equations
A system of two equations in two variables has a graph: two curves (or lines).
The solution is the intersection point(s).
- Two lines: intersect at one point (usually), parallel (no solution), or same line (infinite solutions)
- Line and parabola: 0, 1, or 2 intersections
- Two parabolas: 0, 1, 2, 3, or 4 intersections
The graph shows why certain systems have multiple or no solutions.
Asymptotes
Some graphs approach lines without ever touching them.
y = 1/x:
- As x → ∞, y → 0 (horizontal asymptote y = 0)
- As x → 0⁺, y → ∞ (vertical asymptote x = 0)
Asymptotes show boundary behavior — what the function does at extremes.
Exponential Functions
y = 2ˣ grows rapidly:
- (0, 1), (1, 2), (2, 4), (3, 8)...
- Horizontal asymptote at y = 0 (graph approaches but never reaches)
y = (1/2)ˣ decays rapidly:
- (0, 1), (1, 1/2), (2, 1/4)...
- Also asymptotic to y = 0
Exponentials grow (or decay) by constant factors, which looks like rapid ascent (or descent) on the graph.
Why Graphing Matters
Graphing connects algebra to vision.
Equations are abstract. Graphs are concrete. You can see where a function is positive, where it's increasing, where it crosses the axis.
Before calculators, graphing was the main way to understand complicated functions. Now, graphing technology makes exploration instant — but understanding why the graph looks the way it does still requires algebraic knowledge.
The graph and the equation are two views of the same object. Fluency means moving freely between them.
The Core Insight
A graph is an equation made visible.
Every point on the graph satisfies the equation. The shape of the graph reflects the structure of the equation. Linear equations make lines. Quadratics make parabolas. Exponentials make curves that shoot up or decay.
When algebra confuses you, graph it. When a graph puzzles you, find its equation. The two representations illuminate each other.
Part 11 of the Algebra Fundamentals series.
Previous: Functions: The Input-Output Machines of Mathematics Next: Synthesis: Algebra as the Grammar of Mathematics
Comments ()