String Diagrams: Drawing Your Way to Mathematical Insight
What if you could prove theorems by drawing? String diagrams are the graphical calculus of category theory — a notation so well-suited to composition that manipulating the pictures is the proof.
String Diagrams: Drawing Your Way to Mathematical Insight
Series: Applied Category Theory | Part: 6 of 10
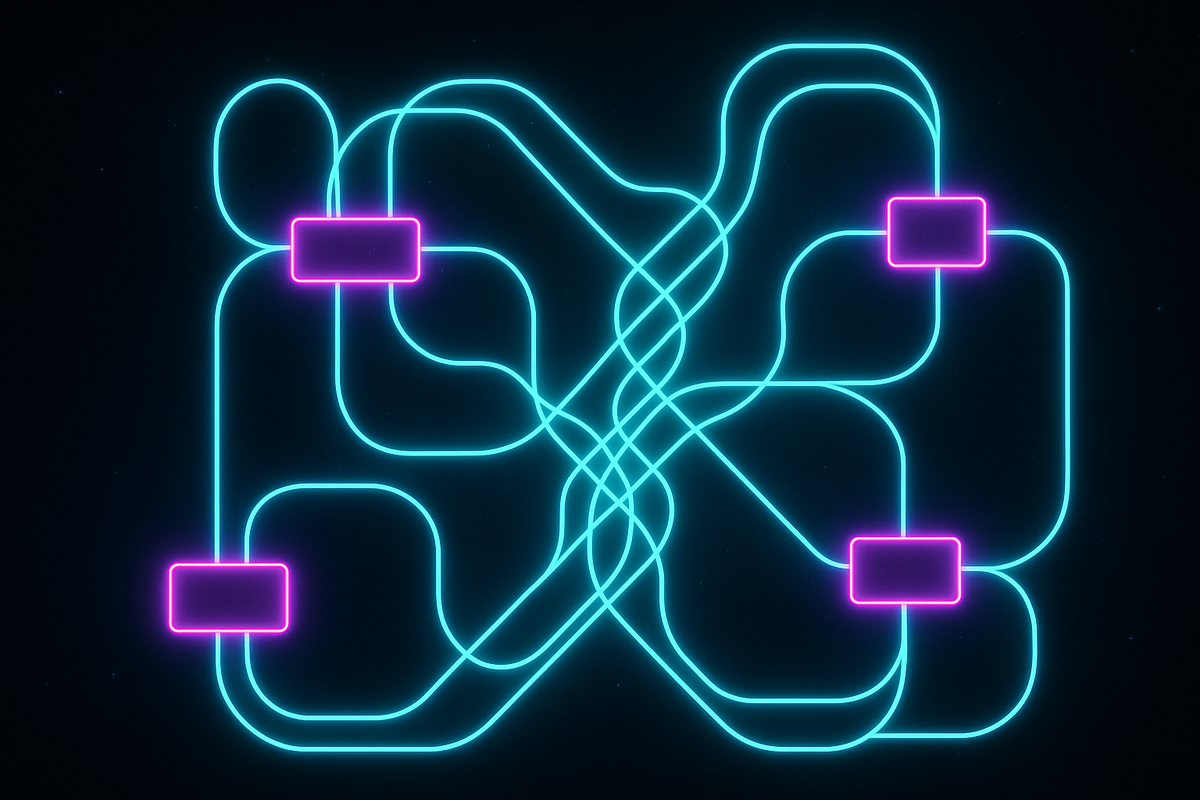
The mathematician draws a picture. Not a decoration, not a visual aid—a proof. Lines flow, boxes connect, wires cross and merge. What looks like a circuit diagram or a subway map is actually doing mathematics. Real mathematics. The kind that lands papers in top journals and solves problems traditional notation couldn't touch.
This is string diagram calculus, and it represents one of category theory's most subversive achievements: turning abstract mathematical reasoning into something you can literally see.
Why Equations Lie and Diagrams Don't
Consider the associativity law from basic algebra: (a + b) + c = a + (b + c). Simple enough. But now consider what happens when you're working with complex compositions of morphisms, functors, and natural transformations. The notation becomes dense, parentheses proliferate, and it becomes genuinely hard to see what's actually being claimed.
String diagrams cut through this fog. They exploit a simple fact: composition in category theory is fundamentally topological. What matters isn't the precise symbolic arrangement but the connectivity pattern—how things wire together. And topology is something humans are exceptionally good at perceiving visually.
The game-changing insight, developed primarily by Roger Penrose in the 1970s and refined by category theorists like Peter Selinger and André Joyal, is this: many equations in category theory correspond to simple diagram manipulations. Associativity isn't an equation to verify—it's the fact that you can slide boxes along a wire without changing what the diagram means.
This isn't metaphor. The diagrams are the mathematics. They're a rigorous formal system with precise rules about when two diagrams are equivalent. And they're often easier to work with than the equations they replace.
The Basic Grammar: Boxes, Wires, and Composition
A string diagram starts simple. You have:
Objects become wires. A wire represents a mathematical object—could be a set, a vector space, a type, whatever your category talks about. The wire doesn't care what the object "is." It only cares about what morphisms flow through it.
Morphisms become boxes. A morphism f: A → B becomes a box labeled f with one wire coming in (representing A) and one wire going out (representing B). The box is a transformation, a process, a function—again, we don't care about internal details, only inputs and outputs.
Composition is vertical stacking. If you have f: A → B and g: B → C, their composition g ∘ f: A → C is drawn by stacking the boxes vertically, with f below and g above. The wires connect automatically because the output type of f matches the input type of g.
Identity is an empty wire. The identity morphism id_A is just a straight wire with no box. This captures the intuition that identity "does nothing"—it's pure passage with no transformation.
Already, you can see something profound: associativity becomes visually obvious. Whether you group (h ∘ g) ∘ f or h ∘ (g ∘ f) doesn't matter because you're just stacking three boxes vertically. The parentheses were always artificial—they were notation conventions, not mathematical content.
Monoidal Structure: When Diagrams Get Interesting
String diagrams become truly powerful when your category has monoidal structure—roughly, when you can put objects "side by side" as well as composing them sequentially. This is where the topology becomes essential.
In a monoidal category, you have:
Tensor product (⊗) as horizontal juxtaposition. If you have objects A and B, their tensor product A ⊗ B is drawn as two wires running in parallel. If you have morphisms f: A → A' and g: B → B', their tensor f ⊗ g is two boxes side by side, each operating independently on its own wire.
Braiding as crossing wires. In many monoidal categories, you have a braiding—a way to swap the order of tensored objects. This becomes a crossing in the string diagram, where one wire passes over or under another. Whether crossings matter depends on whether your category is symmetric (crossings can be "straightened out") or braided (the over/under distinction matters).
Unit object as "no wire." The monoidal unit I is drawn as literally nothing—empty space in the diagram. This captures the intuition that tensoring with I does nothing interesting: A ⊗ I ≅ A.
This is where string diagrams start earning their keep. Consider proving the coherence theorem for monoidal categories—that certain diagrams of structural isomorphisms commute. In traditional notation, this involves pages of symbol manipulation. In string diagrams, you literally watch the wires flex and deform until the equivalence becomes topologically obvious.
Categorical Structures as Visual Patterns
Different categorical structures manifest as characteristic visual patterns in string diagrams. Learning to recognize these patterns is like developing a visual vocabulary for abstract mathematics.
Adjunctions become foldings. An adjunction L ⊣ R between functors L and R corresponds to a specific pattern of unit and counit morphisms. In string diagrams, these appear as characteristic "folds"—places where wires double back on themselves in a controlled way. The triangle identities (which make an adjunction an adjunction) become literally triangular diagrams that collapse to straight wires.
Monads become self-loops. A monad is a monoid in the category of endofunctors—a phrase that terrorizes beginners but becomes clear visually. In string diagrams, a monad on an object A looks like a box with one wire in and one wire out, both labeled A, with specific multiplication and unit operations. The monad laws (associativity and unit) become obvious wire manipulations.
Coalgebras become sources. Where algebras have wires flowing in (consuming data), coalgebras have wires flowing out (producing data). The duality between algebras and coalgebras—central to many areas of theoretical computer science—becomes the literally visual operation of flipping diagrams upside down.
Traced categories become feedback loops. In a traced monoidal category, you can form feedback loops where an output wire loops back to become an input. This is crucial for modeling recursive processes, cyclic systems, and—surprisingly—the graphical calculus of quantum mechanics.
String Diagrams in Quantum Mechanics: The ZX Calculus
One of string diagram calculus's most successful applications is in quantum mechanics, via the ZX calculus developed by Bob Coecke and collaborators. This isn't just pedagogy—it's changed how quantum protocols are discovered and verified.
In ZX calculus:
Quantum states are wires. A wire represents a qubit—a quantum system that can exist in superposition.
Quantum operations are colored boxes. Green boxes (Z-spiders) represent operations in the computational basis. Red boxes (X-spiders) represent operations in the Hadamard-rotated basis. These aren't arbitrary choices—they reflect deep structure in quantum mechanics.
Entanglement is wire splitting. When a wire branches, it creates entanglement between the resulting qubits. The famous EPR pair that Einstein worried about? It's a green box with two output wires.
Measurement collapses to classical wires. When you measure a quantum system, the wire changes character—it becomes classical, carrying definite information rather than quantum superposition.
The remarkable thing is that many quantum protocols—teleportation, superdense coding, error correction—become almost trivial to derive once you express them in ZX calculus. The diagrams expose structure that the traditional Dirac notation obscures. Proofs that take pages of quantum mechanics become visual transformations you can literally see.
This isn't just elegance—it's had practical impact. Researchers have used ZX calculus to optimize quantum circuits, discover new quantum protocols, and verify the correctness of quantum algorithms. The pictures do real work.
Why Visual Reasoning Works: Cognitive Coherence
There's a deeper question here: why do string diagrams work so well? Why is this visual notation often easier than the symbolic notation it replaces?
The answer connects to how human cognition actually operates. We're not symbolic logic machines. We're pattern-recognition systems, embodied agents navigating spatial environments. Our visual processing is fast, parallel, and capable of grasping global structure at a glance.
Topology over algebra. String diagrams exploit topological reasoning—the mathematics of connectivity and deformation—rather than algebraic reasoning—the mathematics of symbolic manipulation. Humans are good at topology. We navigate spaces, recognize objects from multiple angles, understand that routes with the same connectivity are "the same" even if they look different. Algebraic reasoning, by contrast, is cognitively expensive. It requires working memory, sequential processing, careful symbol tracking.
Global vs. local visibility. In traditional notation, understanding a complex expression often requires parsing it step by step, maintaining context in working memory. String diagrams present the entire structure at once. You can see the global wiring before examining individual boxes. This matches how perception works—we grasp scenes holistically before attending to details.
Constraints as affordances. In diagrams, many rules of composition become visually enforced. You can't connect wires with mismatched types—they literally don't line up. You can't forget the associativity law because there's no syntax for non-associative stacking. The constraints that make category theory work become perceptual affordances that guide correct reasoning.
This is coherence in the AToM sense: a system where the structure of the representation matches the structure of what it represents. String diagrams are coherent with compositional reasoning in a way that symbolic notation often isn't. The mathematics and the human cognitive system are entrained—moving together, minimizing the friction of translation.
Limits of the Visual: When Diagrams Break Down
String diagrams are powerful, but they're not universal. They work beautifully for monoidal categories and their extensions, but struggle with some categorical structures.
Higher categories resist flattening. In a 2-category, you have morphisms between morphisms. String diagrams can handle this by adding a third dimension or using surface diagrams, but the visual clarity starts to degrade. By the time you reach ∞-categories, the diagrammatic approach becomes unwieldy.
Large-scale composition gets cluttered. While individual diagrams are clear, compositions involving dozens of morphisms become visual spaghetti. There's a sweet spot of complexity where diagrams excel—complex enough to benefit from visualization, simple enough to remain comprehensible.
Not all equivalences are topological. Some categorical equivalences don't correspond to simple diagram deformations. When this happens, you need to supplement string diagrams with symbolic reasoning, losing some of the cognitive advantages.
Pedagogical deception. The ease of diagrammatic reasoning can create false confidence. Students sometimes develop the ability to manipulate diagrams without fully understanding what the boxes and wires represent. The visual intuition is powerful, but it's not a substitute for understanding the categorical structures themselves.
The lesson isn't that string diagrams are overrated—they're genuinely transformative. But they're a tool, not magic. They work because they align with specific mathematical structures (monoidal categories) and specific cognitive capacities (spatial reasoning). Outside those conditions, their advantages diminish.
String Diagrams and Meaning-Making
There's a philosophical dimension here that connects to the deeper AToM framework. String diagrams suggest something about the nature of mathematical understanding itself.
Meaning is compositional structure made visible. What makes a mathematical concept meaningful isn't just its formal definition but how it composes with other concepts. String diagrams make composition the primary feature—boxes exist to be wired together. This matches the category theory ethos: things are defined by their relationships, not their internal nature.
Understanding is pattern recognition. When you "understand" a proof in string diagrams, you're not following a chain of logical deductions. You're recognizing a visual pattern—this configuration of wires and boxes is equivalent to that simpler configuration. This is closer to how actual mathematical insight works: sudden recognition of structure, not mechanical symbol manipulation.
Diagrams externalize reasoning. String diagrams are a form of extended cognition—they offload cognitive work onto the external environment. Instead of maintaining complex compositional structure in working memory, you draw it. The diagram becomes a stable perceptual object you can examine from multiple angles. This is M = C/T at work: meaning emerges when you have coherent structure (the diagram) that persists through time, allowing you to build understanding iteratively rather than holding everything at once.
Visual formalism is still formalism. This isn't anti-rigor. String diagrams have precise rules, formal equivalence conditions, and mechanical verification procedures. They're not "pictures instead of math"—they're a different notation for the same rigorous mathematics, one that happens to align better with human perceptual capacities.
Practical Applications: Where String Diagrams Are Used
Beyond quantum mechanics, string diagrams have found applications across theoretical computer science and mathematics:
Programming language semantics. Categorical semantics for functional programming languages are often clearest in diagrammatic form. The compilation pipeline—from source code to machine instructions—can be understood as a series of functorial transformations, naturally expressed as string diagrams.
Neural network architectures. Deep learning architectures are compositional systems—layers stacked and combined. Expressing them categorically via string diagrams reveals structural patterns, enables formal verification, and suggests systematic design principles. This was the subject of our previous article on neural networks as functors.
Process theories. Any domain where you have processes that compose—electrical circuits, signal processing, biological systems—can potentially benefit from categorical and diagrammatic modeling. The operad formalism (upcoming in this series) extends this even further.
Proof assistants and automated reasoning. String diagrams are being incorporated into proof assistants like Coq and Agda, allowing formal verification of categorical properties through diagrammatic reasoning. The visual and formal aspects reinforce each other.
Chemistry and molecular biology. Some researchers are exploring categorical models of chemical reactions and metabolic pathways, where molecules are objects and reactions are morphisms. String diagrams provide intuitive representations of reaction networks.
The thread connecting these applications: they're all compositional domains where parts combine according to systematic rules. Category theory captures the abstract structure, and string diagrams make that structure perceptually accessible.
Learning to Think Diagrammatically
If you're used to traditional mathematical notation, shifting to diagrammatic reasoning requires recalibrating your mathematical intuition. Here are the key cognitive moves:
Stop asking "what is it?" Category theory teaches that objects are defined by their relationships. String diagrams enforce this: a wire is just a wire. What matters is what flows through it, what transforms it, how it connects. Embrace the topological mindset.
Let equivalences be deformations. When two diagrams are equivalent, it's often because one can be continuously deformed into the other. Train yourself to see equations as topological facts: this configuration of boxes and wires is the same shape as that one.
Draw before you calculate. When faced with a compositional problem, sketch the diagram first. Let the visual structure guide your reasoning. You'll often spot simplifications or patterns that weren't obvious in notation.
Check your wiring. Many mistakes in categorical reasoning amount to "type errors"—trying to compose things that don't fit together. In diagrams, these become literally impossible to draw (the wires don't connect). Use this as a debugging tool.
Build a visual vocabulary. Learn to recognize the characteristic patterns—adjunction folds, monad loops, traced feedback. They appear repeatedly across different contexts, and recognizing them speeds understanding dramatically.
String Diagrams and the Geometry of Coherence
In AToM terms, string diagrams are a representation technology that increases coherence between mathematical structure and human cognition. They reduce the cognitive "tension" in understanding category theory by making compositional relationships perceptually obvious.
This is M = C/T in action: meaning equals coherence over tension. Traditional notation for complex categorical proofs has high tension—lots of working memory load, easy to make errors, difficult to maintain global understanding. String diagrams reduce that tension by externalizing structure into perceptual space. The coherence remains (the mathematics is fully rigorous), but the tension drops. The result: increased meaning—easier understanding, faster insight, more reliable reasoning.
The success of string diagrams hints at something more general: formal systems that align with human cognitive structure will tend to be more productive than those that don't, even when they're expressing exactly the same mathematical content. There isn't a single "best" way to do mathematics—there are different notations that couple more or less effectively with human perceptual and cognitive systems.
Category theory, in embracing diagrammatic reasoning, has implicitly recognized something about how mathematical understanding actually works. It's not pure symbol manipulation. It's pattern recognition, spatial reasoning, topological intuition. The categories and functors and natural transformations are real mathematical structures, but string diagrams make those structures cognitively available in a way that pure formalism often can't.
Further Reading
Foundational Papers:
- Selinger, P. (2011). "A Survey of Graphical Languages for Monoidal Categories." New Structures for Physics, Springer.
- Joyal, A., & Street, R. (1991). "The Geometry of Tensor Calculus, I." Advances in Mathematics 88(1): 55-112.
- Penrose, R. (1971). "Applications of Negative Dimensional Tensors." Combinatorial Mathematics and its Applications, Academic Press.
Quantum Applications:
- Coecke, B., & Kissinger, A. (2017). Picturing Quantum Processes: A First Course in Quantum Theory and Diagrammatic Reasoning. Cambridge University Press.
- Duncan, R., & Perdrix, S. (2020). "Pivoting Makes the ZX-Calculus Complete for Real Stabilizers." Quantum Information and Computation 13(9-10): 812-827.
Computational Applications:
- Fong, B., & Spivak, D. (2019). An Invitation to Applied Category Theory: Seven Sketches in Compositionality. Cambridge University Press.
- Ghica, D., & Jung, A. (2016). "Categorical Semantics of Digital Circuits." Formal Methods in System Design 46(2): 147-165.
Cognitive Perspectives:
- Cheng, E. (2023). "The Logical and Conceptual Structure of String Diagrams." Synthese 201: 159.
This is Part 6 of the Applied Category Theory series, exploring how categorical abstractions reshape our understanding of structure and composition.
Previous: Neural Networks as Functors: Category Theory Meets Deep Learning
Next: Sheaves and Contextuality: How Category Theory Models Context-Dependent Meaning
Comments ()